前情提要
最近线上一个图片服务在使用ehcache的diskcache替代旧版“自实现”的磁盘缓存时,发生了java进程常驻内存暴涨导致部署机器内存耗尽的问题。
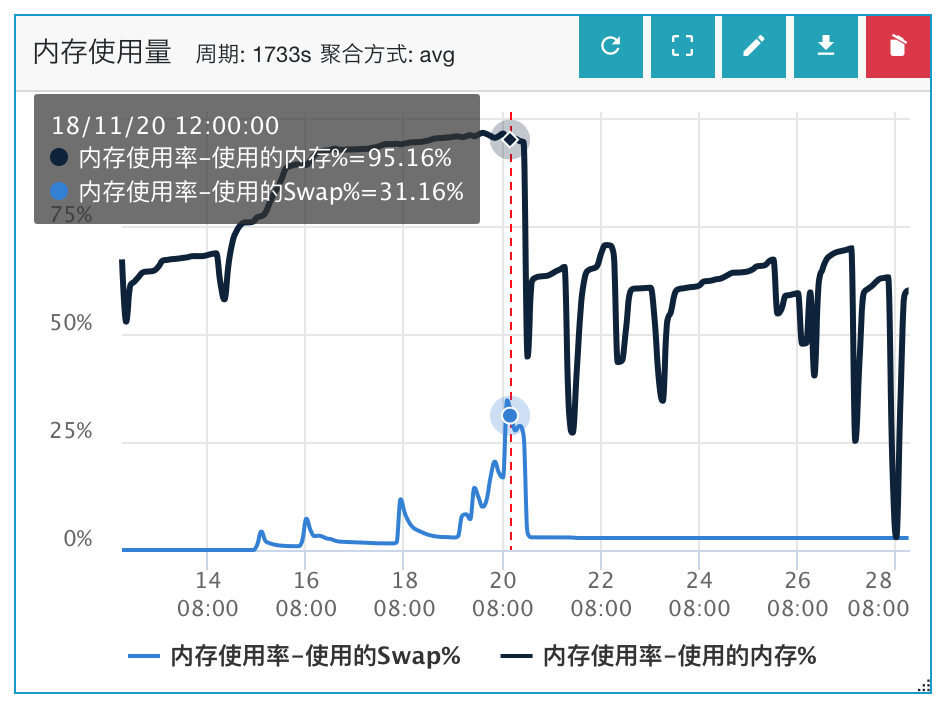
具体现象是:机器内存32G,堆内存设置Xmx 20G,服务启动后发现java进程使用的常驻内存(RES)逐渐上涨,几天后整体RES达到了惊人的29G(升级ehcache前大概RES峰值在23G),导致系统开始吃swap,服务性能下降严重。
因为以前也分析过一个“由于glibc的ptmalloc2内存分配机制缺陷”导致堆外内存溢出的问题(具体可移步Java堆外内存增长问题排查Case),但出问题的业务已经优化过arena内存池参数,排除了这一块的嫌疑,因此具体原因还需要另做分析。
排查过程
1. 确认堆内内存是否使用正常
GC情况分析
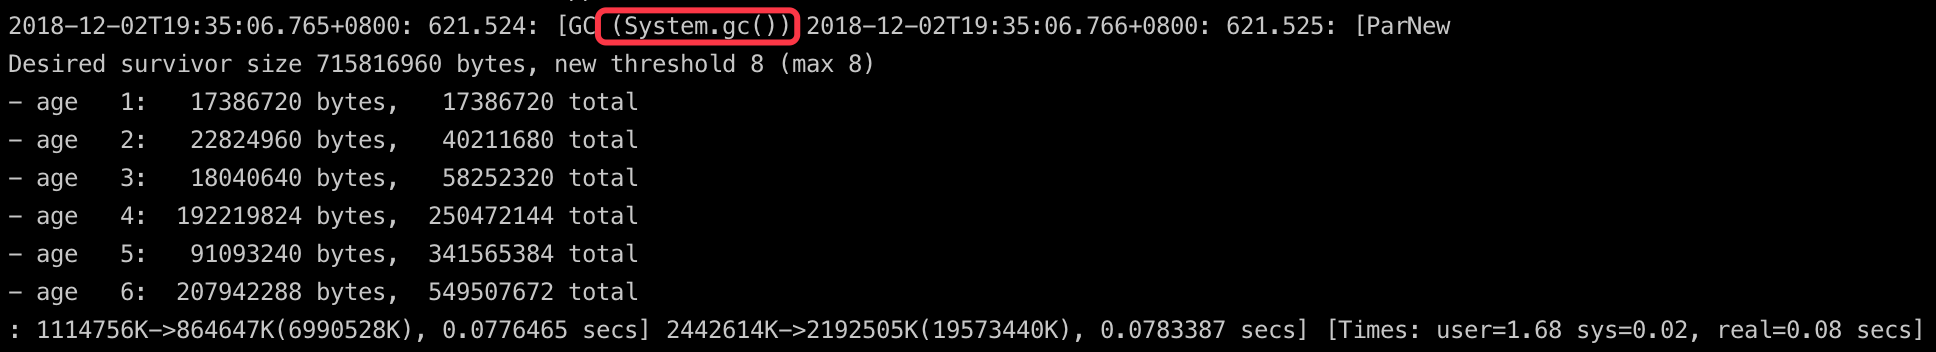
先通过GC日志分析堆内存是否存在问题。GC日志看出现问题时年轻代的GC没有问题,很正常。
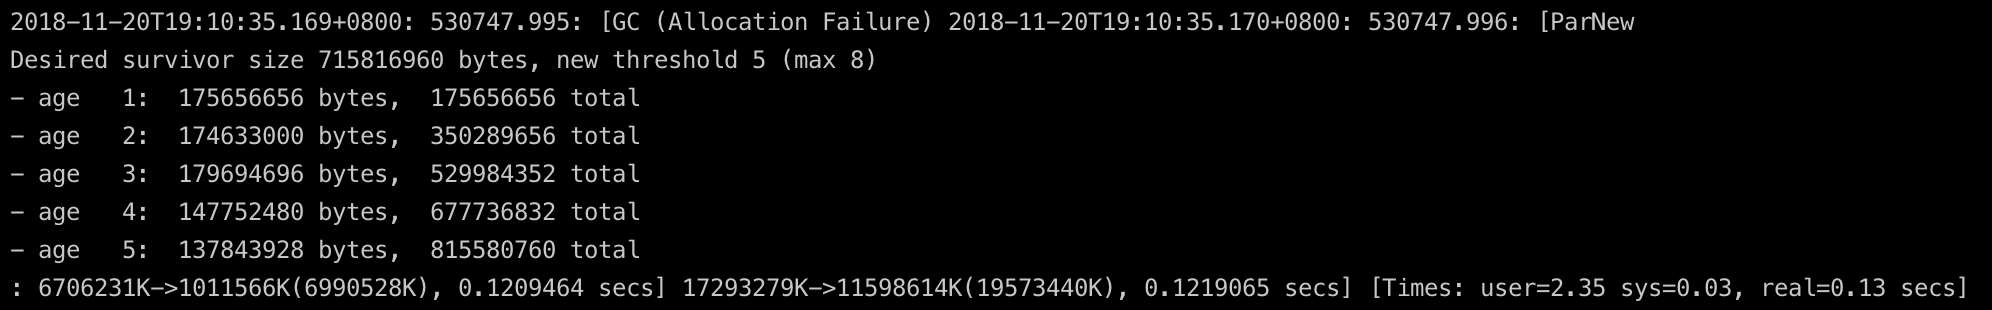
年老代GC除了回收频率较快(配置问题,这里暂且不表),也没有什么异常情况。
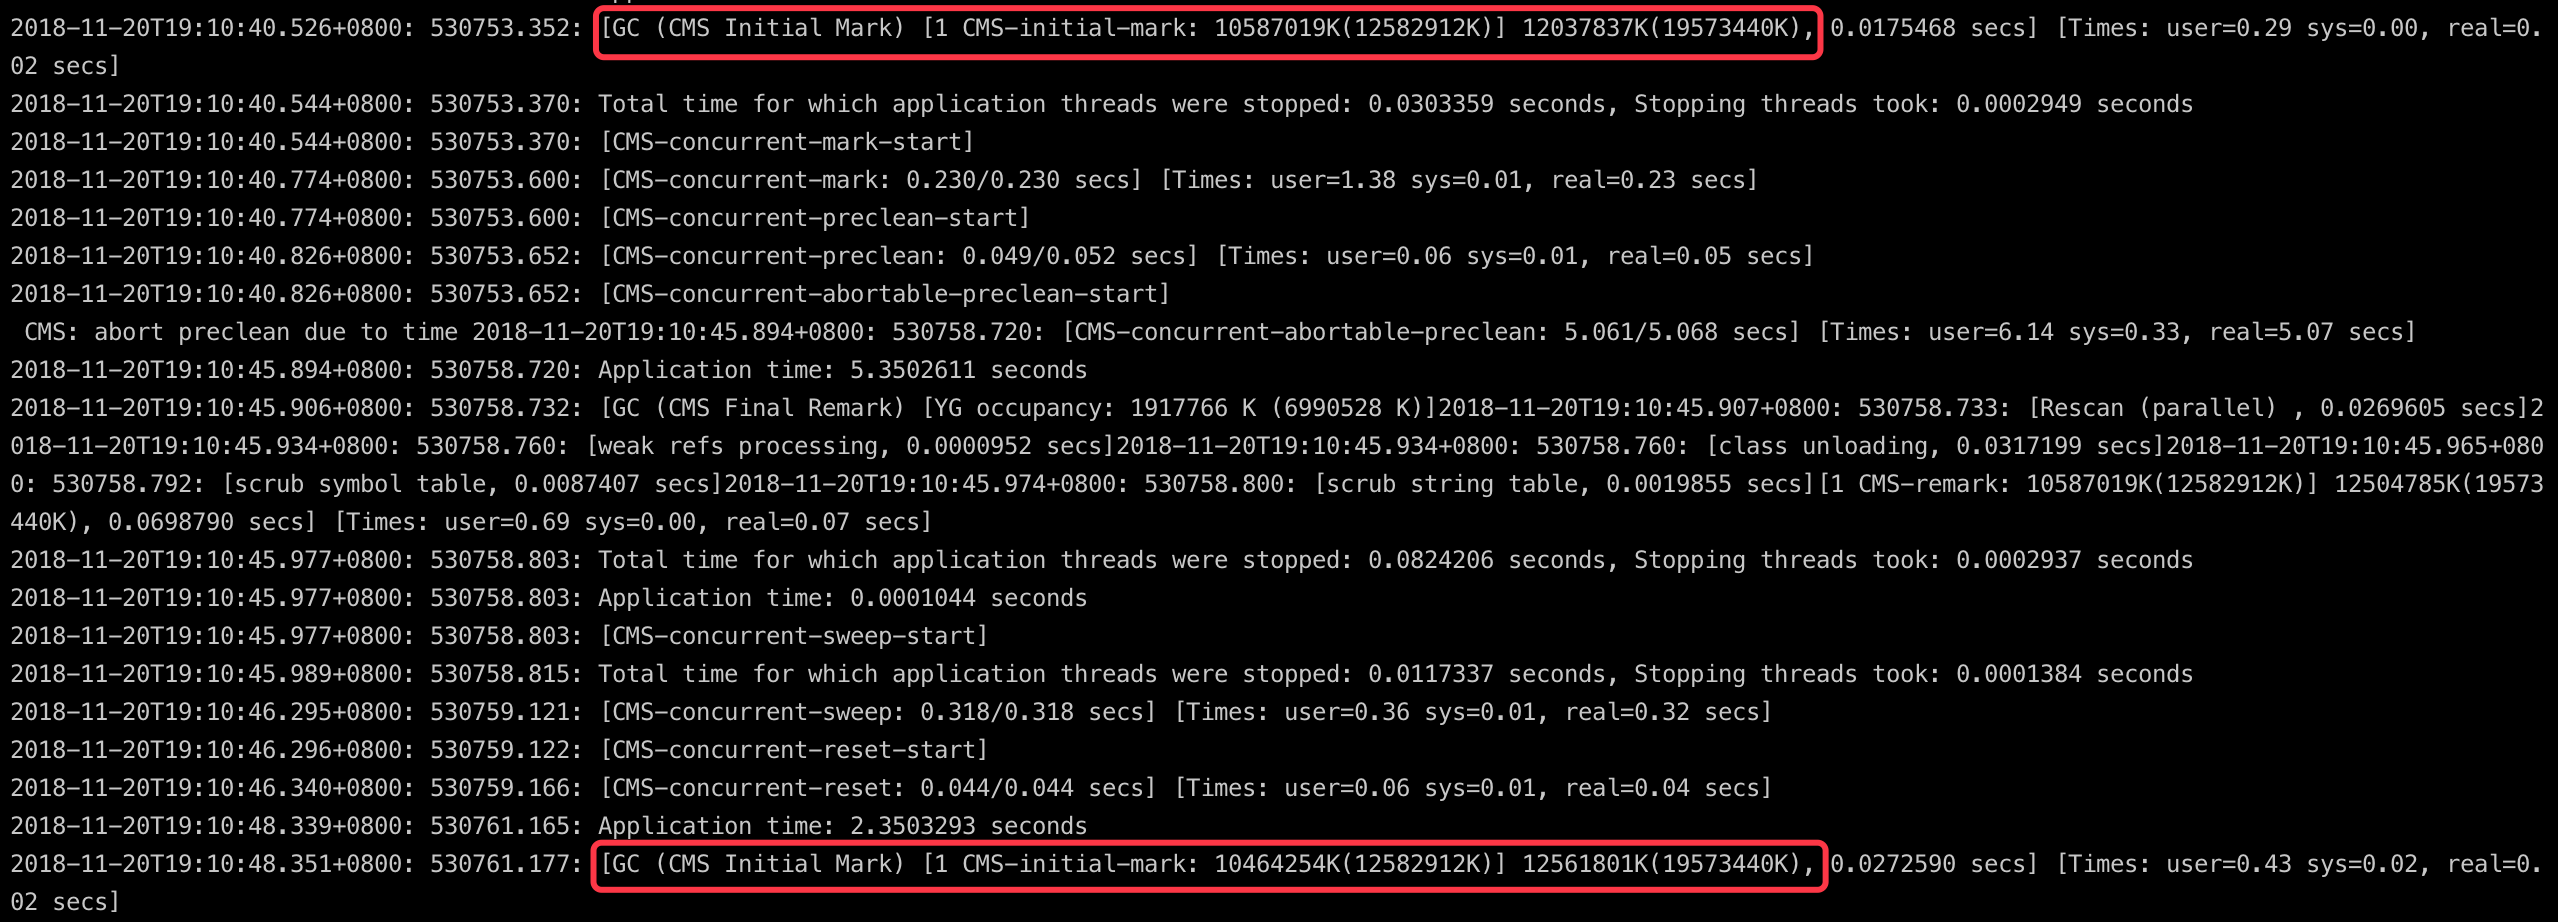
另外,出问题时整体也没有Full GC、提升失败(promotion failedl)、并发模式失败(concurrent mode failure)这些异常情况。
堆dump进一步确认
为进一步确认堆内存是否正常,把出问题时的堆dump下来分析。
jmap -dump:file=199.bin 12
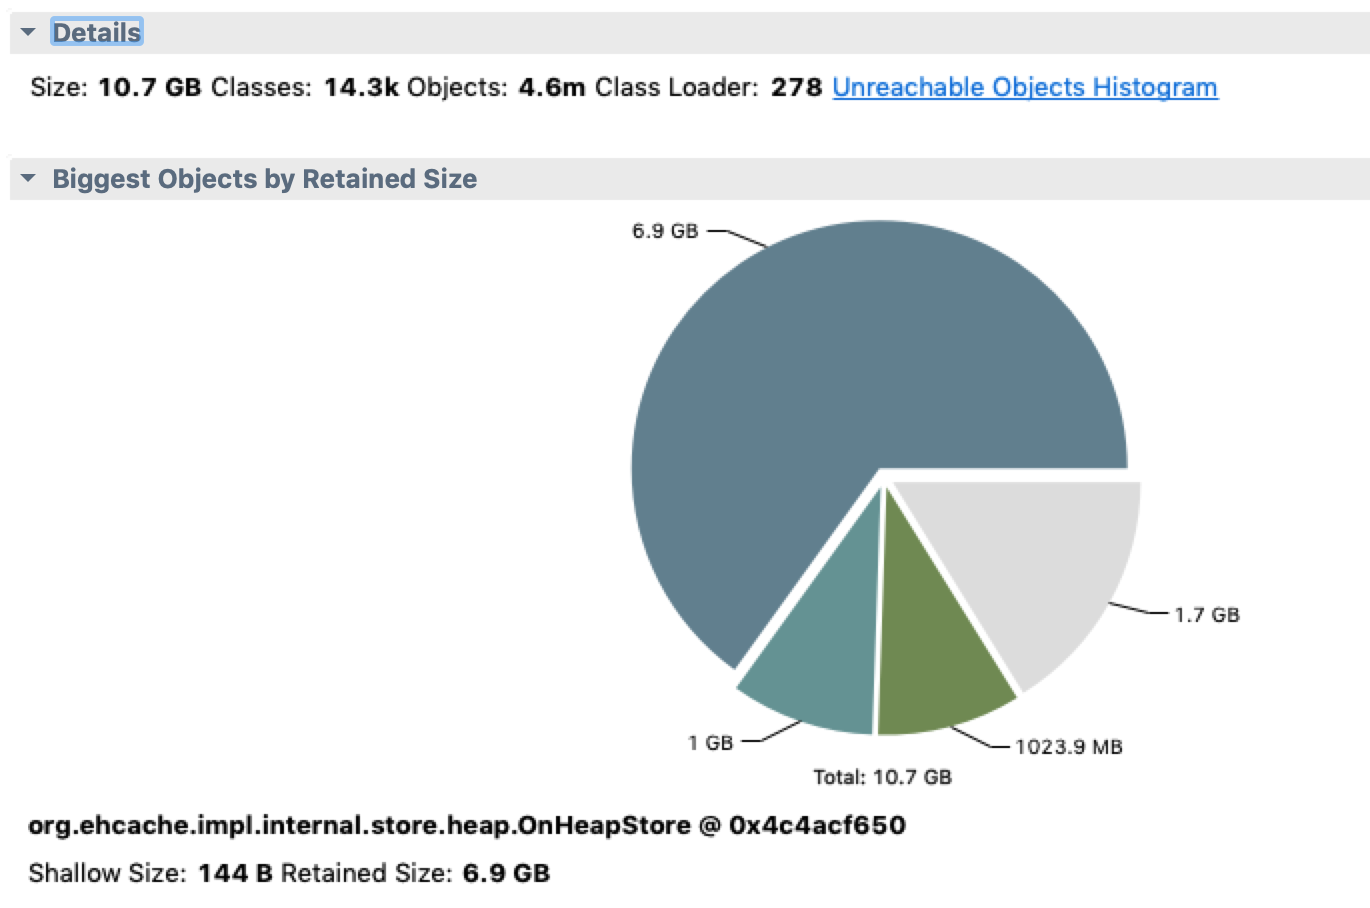
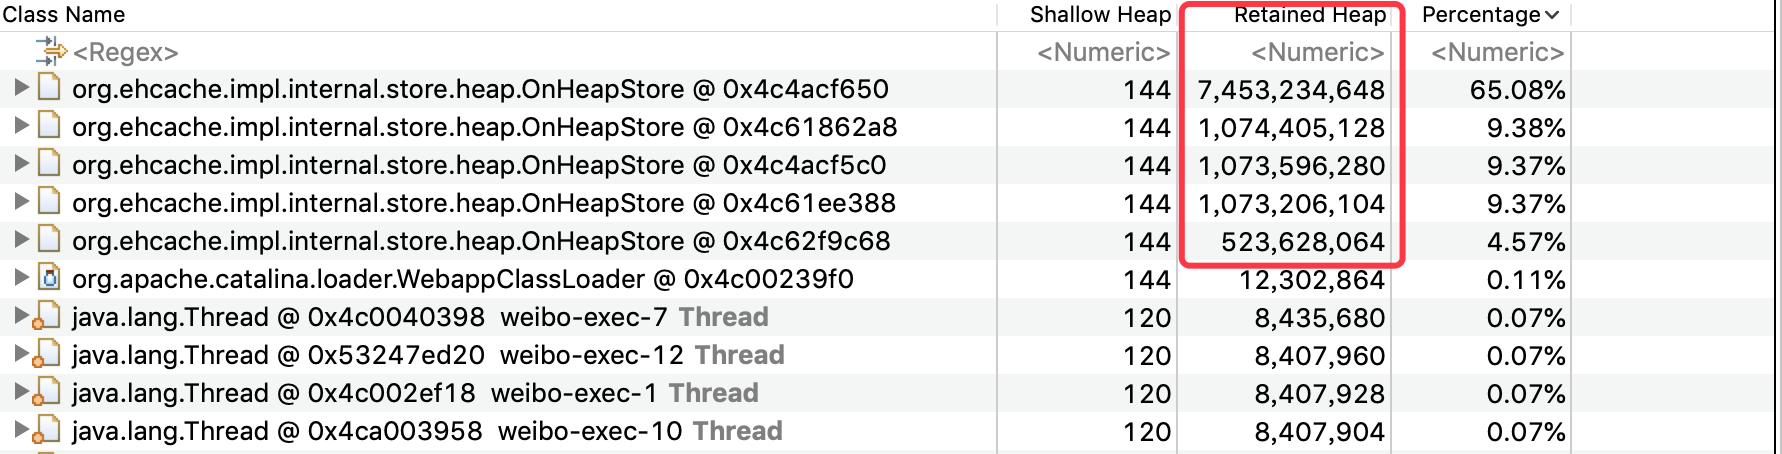
可以看到基本上都是ehcache使用的堆内存,使用量和业务里配置的也都一致,dominator_tree上看其他对象都比较小,基本没有嫌疑。
这里基本确认了堆内存使用正常。
2. 查看java进程占用内存的具体情况
由于top命令只能看到当前进程使用的整体情况,所以这里使用pmap来详细列出内存使用的情况,因为我们关心的是实际使用的物理内存而不是进程映射的虚拟内存,所以这里使用-x来显示pmap的扩展格式才能看到常驻内存RES。
PS: pmap命令的输出内容来自于/proc/[pid]/maps和/proc/[pid]/smaps这两个文件,maps文件包含了每一段内存的大概描述,smaps里包含了具体每段的详细信息。
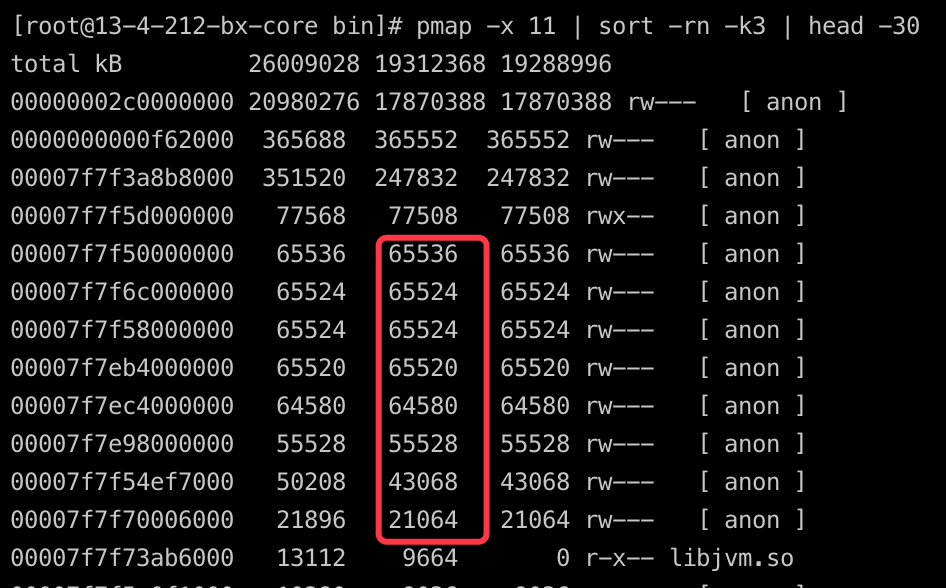
pmap -x 12 | sort -rn -k3 | head -30
这里按照RES的占用大小来进行排序,取占用Top 30的内存段。
发现较多的几十兆的大内存块,和正常的未灰度的机器的内存使用比,有比较大的嫌疑。
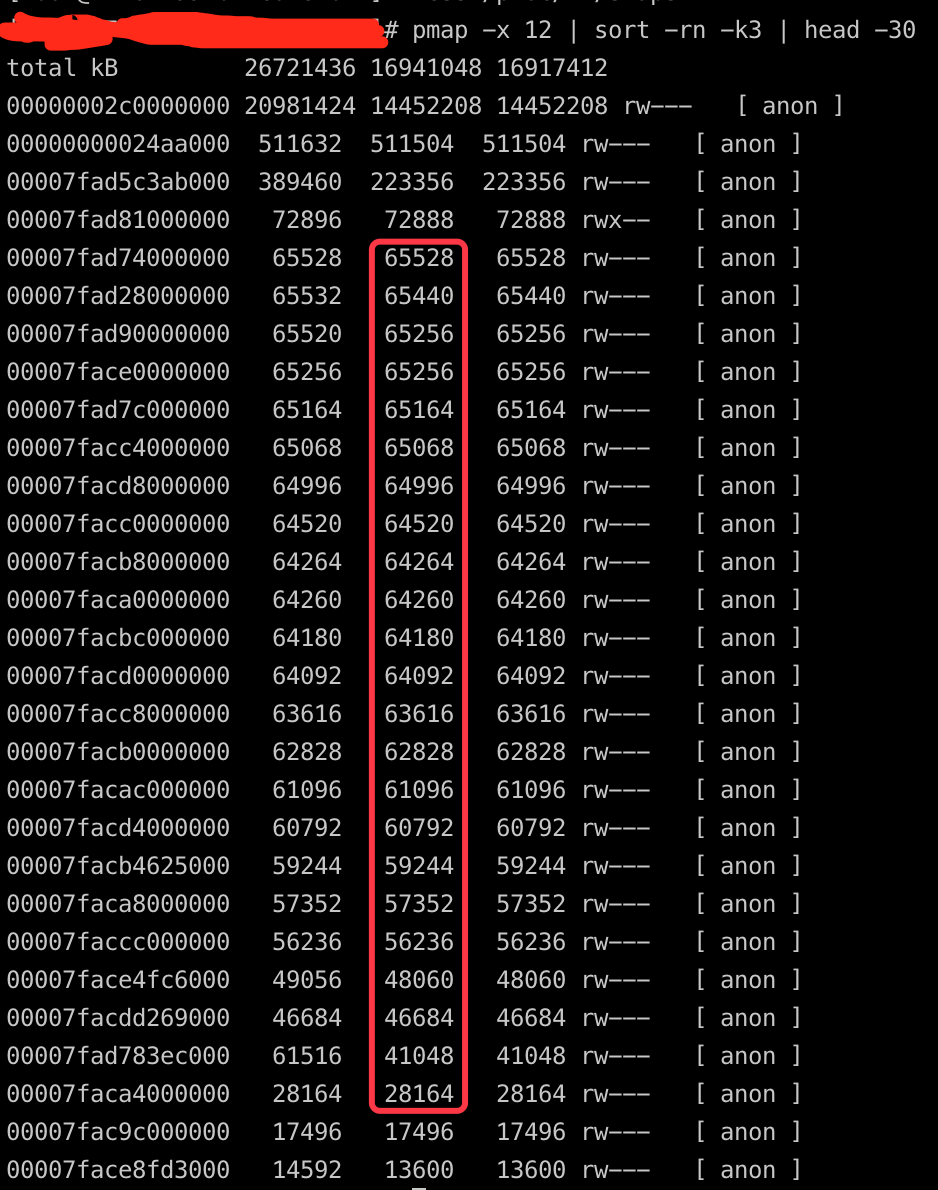
找一块比较有嫌疑的内存段dump下来看一下里面的具体内容,这里选取了有问题的进程的46684K的那一段。
gdb --batch --pid 12 -ex "dump memory 199.dump 0x7facdd269000 0x7facdd269000+46684000"
hexdump -C 199.dump | less
发现貌似都是一些非文本的二进制数据,具体分析不出来内容,基本放弃直接通过内存段内容来定位问题了。
3. NMT跟踪JVM本地内存的使用情况
在之前的文章有提到过,Native Memory Tracking是JDK7U40引入的HotSpot新特性,可用于监控JVM原生内存的使用,java进程启动时指定开启NMT(有一定的性能损耗),输出级别可以设置为“summary”或“detail”级别,开启后,通过jcmd可以访问收集到的数据。JVM启动时加上:
-XX:NativeMemoryTracking=summary 或者 -XX:NativeMemoryTracking=detail
具体NMT的使用可以在NMT使用说明和使用NMT排查问题里查看,NMT支持summary和detail级别的track,另外还支持基于baseline的比对track。在这个case里由于堆外内存是缓慢增长的,因此比较好的方式是采用baseline的比对方式来排查,这样方便看增长期间具体堆外内存的变化情况。
具体操作:
- 先建立跟踪基线,并记录当时的内存使用情况,放置一段时间。
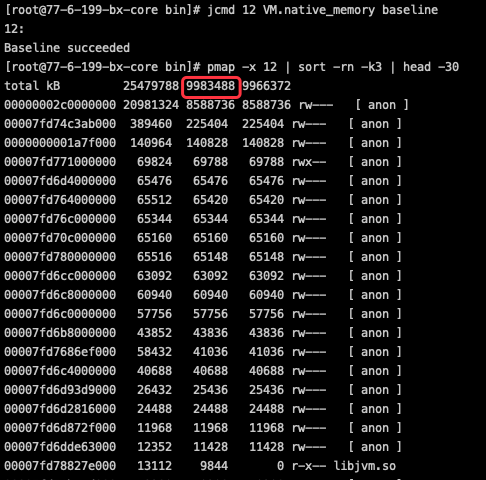
jcmd 12 VM.native_memory baseline
- 运行一段时间后,和基线做diff,看下堆外内存的具体变化情况。
jcmd 12 VM.native_memory summary.diff
或者
jcmd 12 VM.native_memory detail.diff
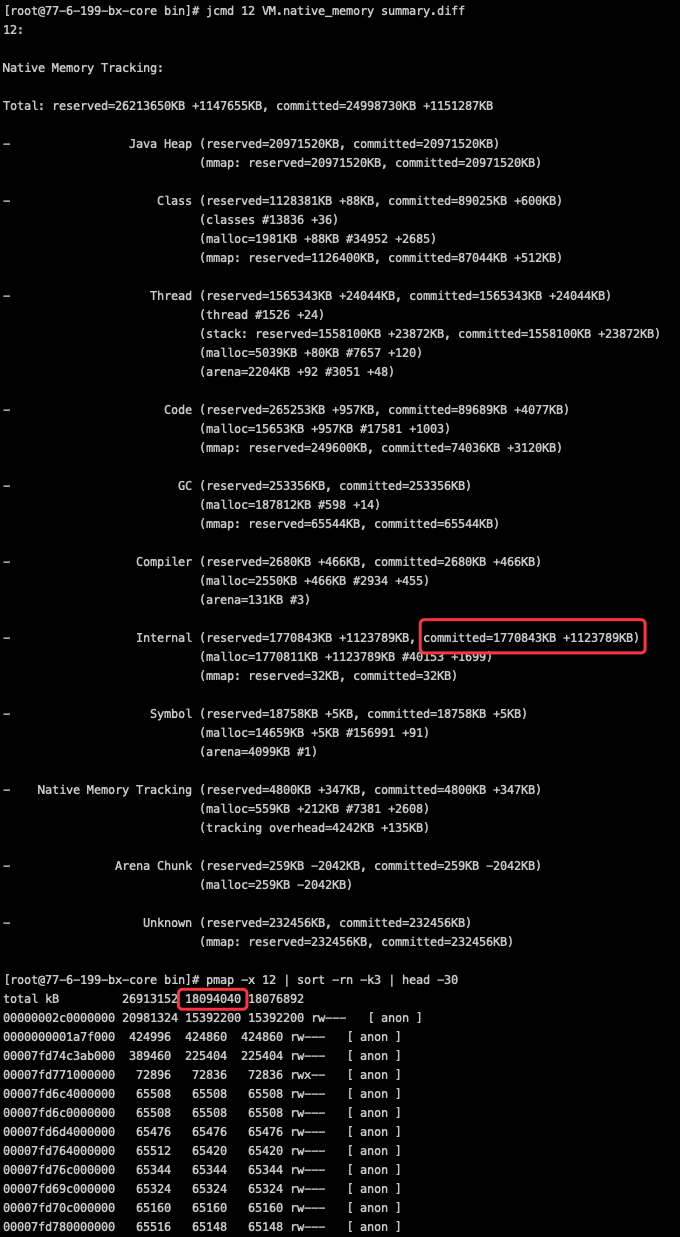
从图可知,java堆占用增长了6.8G,整体内存(RES)增长 8.1G,非堆内存增加大概1.3G,其中绝大部分来自于Internal部分的增长,按照oracle官方的解释,Internal部分的内存主要用于: Memory that does not fit the previous categories, such as the memory used by the command line parser, JVMTI, properties and so on. 值得注意的是,DirectByteBuffer的内存使用实际上也属于Internal的类别。因为像JVMTI和properties这些项目都没有用到,因此把重点锁定到DirectByteBuffer这个容易出问题的对象上。
4. JMC(Java Mission Control)查看DirectByteBuffer的占用
JMC作为JVisualVM的替代工具,功能强大,而且免费。非代码植入的采样机制对系统性能影响也比较小,很多公司在线上也是开着JMC的。这里不展开,有兴趣的可自行查询。
- 第一步,JVM开启jmx。 JVM启动时加上:
-Dcom.sun.management.jmxremote.port=7001 -Dcom.sun.management.jmxremote -Dcom.sun.management.jmxremote.authenticate=false -Dcom.sun.management.jmxremote.ssl=false -Djava.rmi.server.hostname=your ip
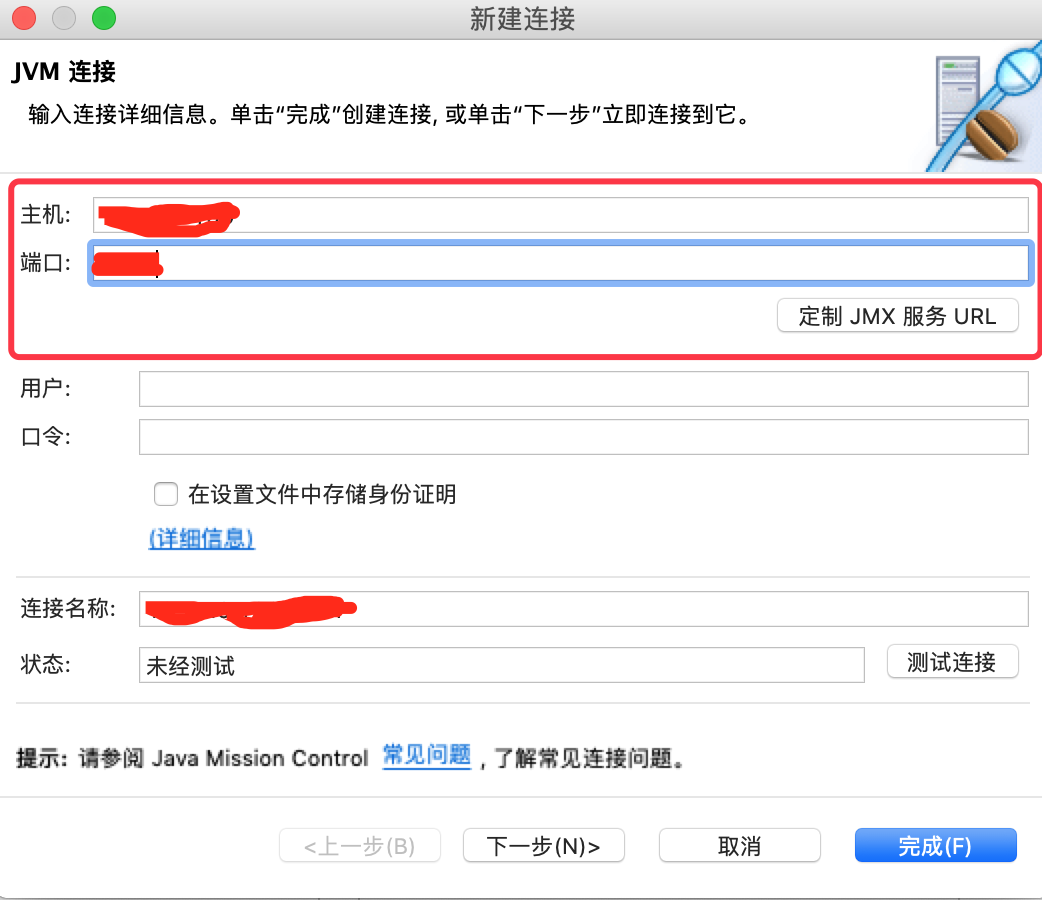
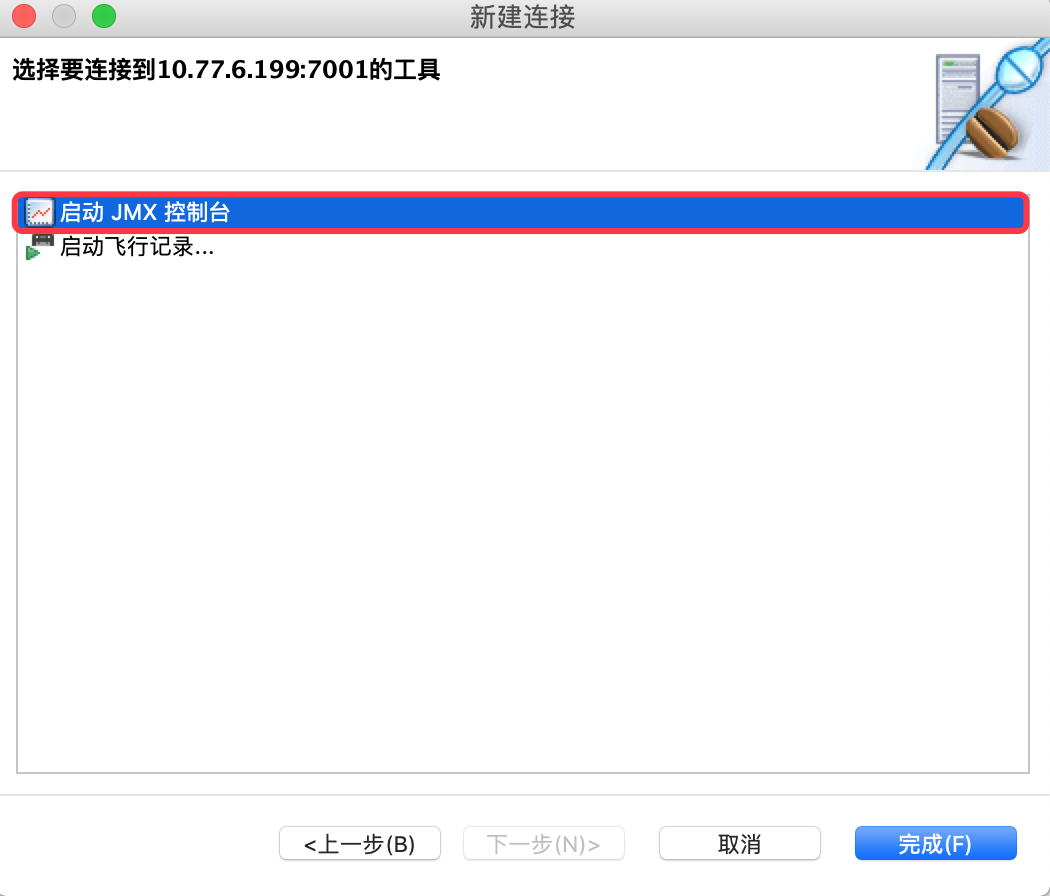
- 第二步,本机打开JMC工具,通过jmx远程连接,并启动JMX控制台。
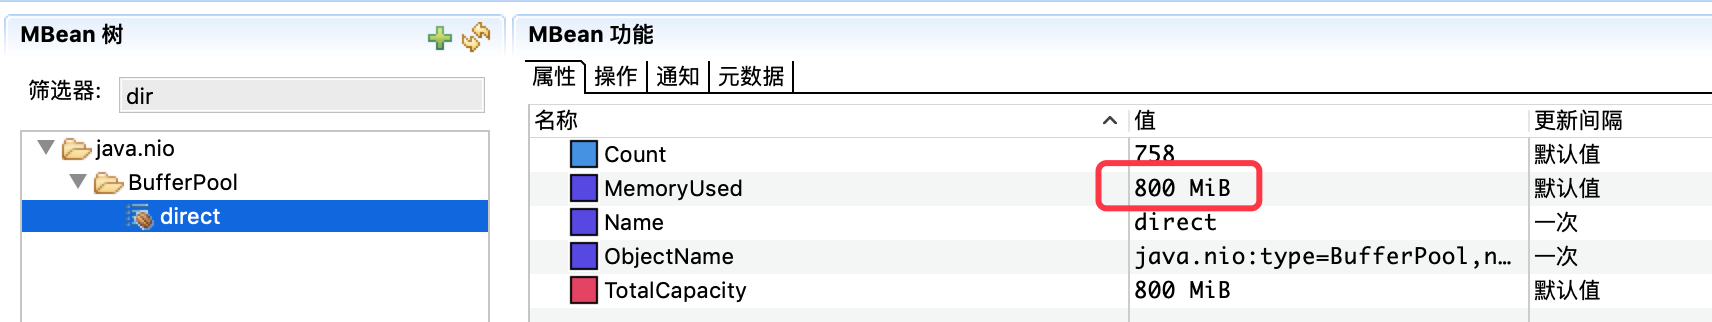
- 第三步,通过MBean浏览器筛选出DirectByteBuffer的跟踪器。
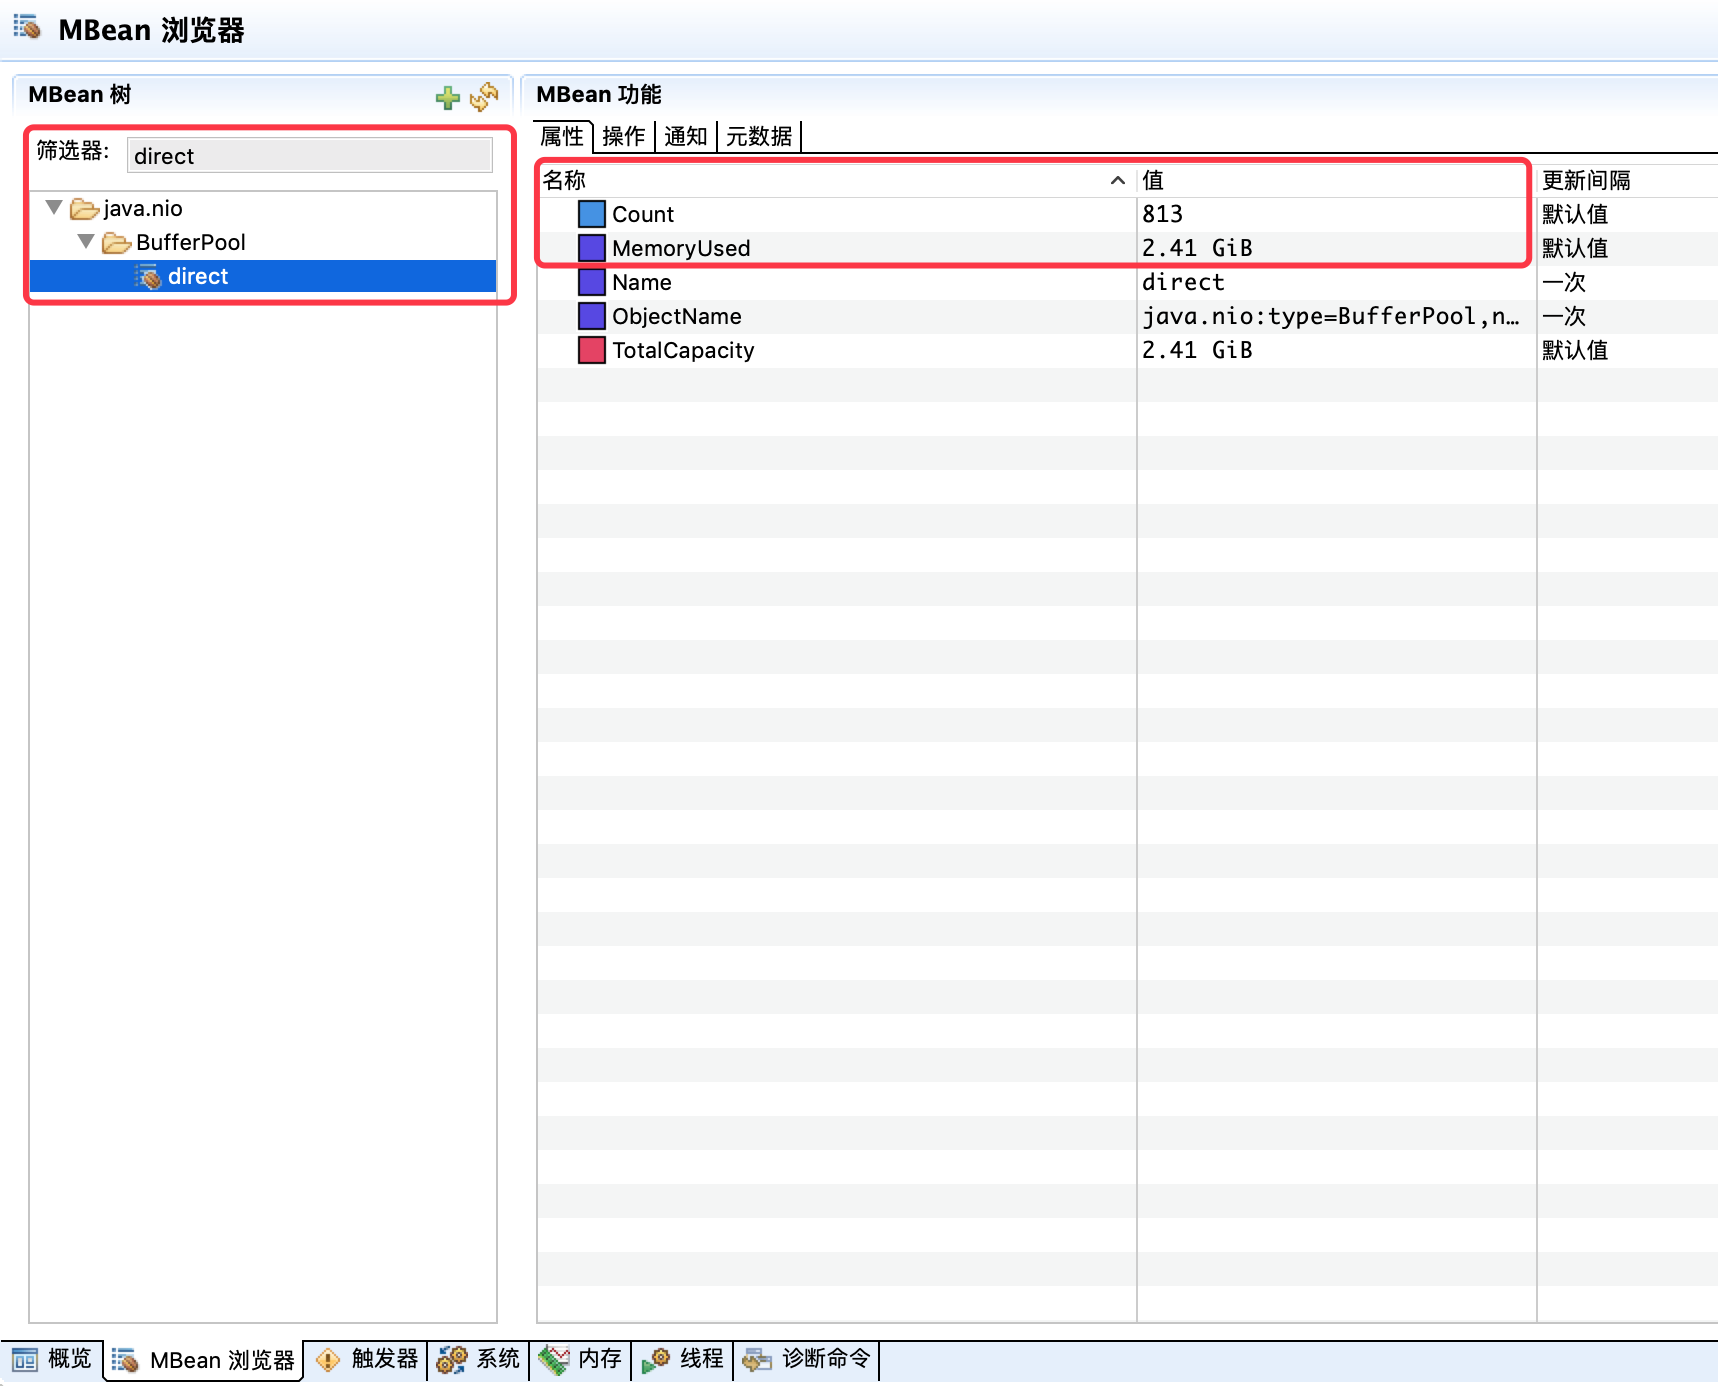
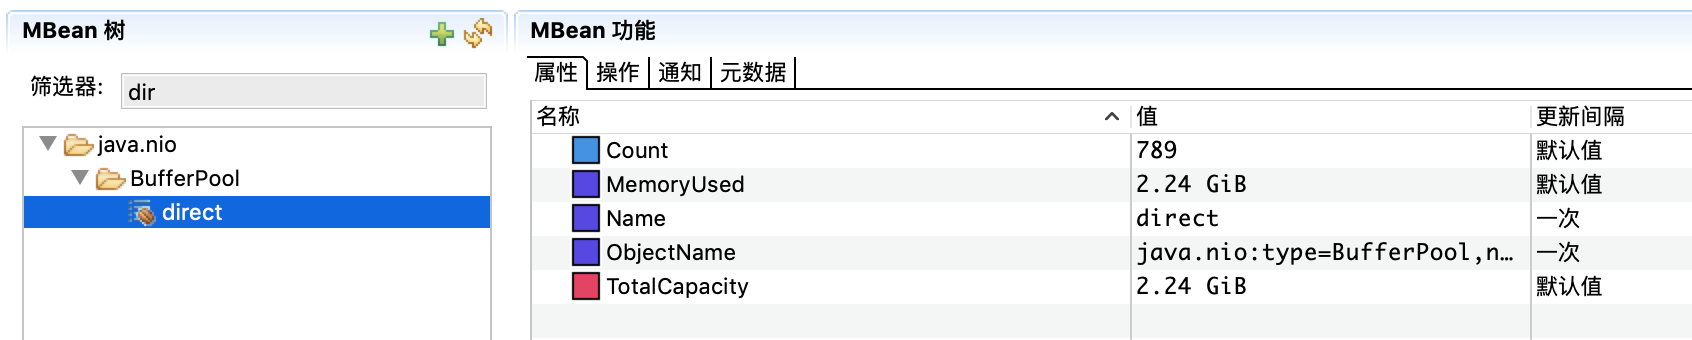
果然,在只有813个对象的情况下,DirecByteBuffer的使用居然达到了2.4G,平均每个对象达到了3M。观察一段时间,发现DBB的增长和NMT里Internal部分的增长基本一致,和pmap里增多的几十M的内存段的总和也能对上。
- 第四步,比对正常机器的DBB。
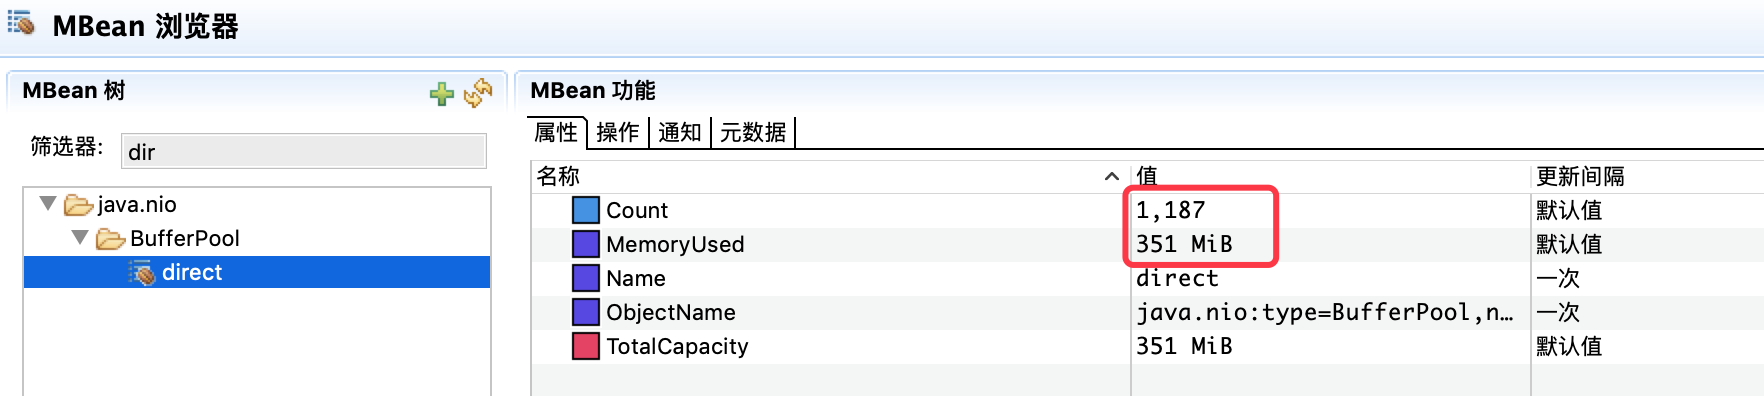
发现正常机器DBB的占用内存量比问题机器的占用量小很多,且基本保持稳定,有问题的机器的DBB内存占用量还在持续上涨,到这里基本可以确定是由于DBB的内存占用导致的问题。
5. 分析DirectByteBuffer的使用情况
定位到DBB的问题后,接下来需要确定具体是哪里导致DBB的内存占用量飙涨。这里先普及一下DirectByteBuffer。
DirectByteBuffer是JDK提供的一个缓冲池类,通常被用于通信框架中,如netty,mina等。DirectByteBuffer在创建的时候会通过Unsafe的native方法来直接使用malloc分配一块堆外内存。注意:由于这块内存真正的分配并不在Java堆中(堆中只有一个很小的对象引用,因此也被称为冰山对象),这种方式能减轻GC的压力;另外,对于堆内对象,如果要进行IO操作(Socket、文件读写)时,需要先把对象拷贝一份到堆外直接内存,然后再写入Socket或者文件,但由于DirectByteBuffer本身就是在堆外内存分配,因此进行IO时不需要再做那一次从堆内拷贝到堆外的操作,性能上会更好。值得注意的是:由于java堆内存是预申请好的,对于堆内对象的内存分配性能很好,相比较,DirectByteBuffer这种用时才通过malloc、free向操作系统临时申请内存的方式性能会慢一些,因此类似Netty这种IO框架,会对DirectByteBuffer进行池化管理,多次复用,避免每次都需要向操作系统申请和释放内存的开销。
DirectByteBuffer的内存分配和回收
基本流程: 先通过Bits.reserveMemory申请内存额度,Bits类维护了一个全局的totalCapacity用于记录已分配的全部DirectByteBuffer的总大小,jVM提供了一个-XX:MaxDirectMemorySize的设置(默认等于Xmx的大小),用来限制可以分配的总的DirectByteBuffer的内存大小,如果没有超限,就调用native的Unsafe.allocateMemory去执行真正的内存分配(实际就是调用malloc);如果额度已满,就先调用tryHandlePendingReference尝试进行非阻塞的堆外内存回收,如果还是分配不到,就会通过System.gc进行一次Full GC,再尝试几次分配,如果还是不成功就抛出一个DirectByteBuffer的OOME。
每个DirectByteBuffer在生成时会绑定一个Cleaner对象,这个Cleaner对象是一个PhantomReference(具体啥是幻象应用请自行搜索),当JVM GC时发现那些除了Cleaner幻象引用外已没有其他引用的DirectByteBuffer时,就会把这些Cleaner对象放到Reference这个类的pending列表里,Reference类维护了一条ReferenceHandler的高优先级线程,这条线程会不断去轮询待处理的pending列表,如果是Cleaner对象就调用这个对象的clean方法进行清理,clean方法里其实是调用初始化Cleaner时绑定的Deallocator间接使用unsafe.freeMemory来进行堆外内存的释放和Bits里全局堆外内存使用量的更新。
PS:实际并不存在一个pending列表,JVM将要被处理的Cleaner对象被封装成一个链表,通过Reference类中的discovered进行排队,ReferenceHandler线程只需要不停地拿到pending,然后再通过discovered不断地拿到下一个对象赋值给pending即可,直到取到了最有一个。因为这个pending对象,两个线程都可能访问,因此需要加锁处理。
先看下分配的代码:
DirectByteBuffer的构造函数,先通过Bits工具类根据维护的总堆外内存情况来进行预分配,然后再预分配OK的情况下使用unsafe来进行真正的堆外内存分配。
DirectByteBuffer(int cap) {                   // package-private
        super(-1, 0, cap, cap);
        boolean pa = VM.isDirectMemoryPageAligned();
        int ps = Bits.pageSize();
        long size = Math.max(1L, (long)cap + (pa ? ps : 0));
        Bits.reserveMemory(size, cap);

        long base = 0;
        try {
            base = unsafe.allocateMemory(size);
        } catch (OutOfMemoryError x) {
            Bits.unreserveMemory(size, cap);
            throw x;
        }
        unsafe.setMemory(base, size, (byte) 0);
        if (pa && (base % ps != 0)) {
            // Round up to page boundary
            address = base + ps - (base & (ps - 1));
        } else {
            address = base;
        }
        cleaner = Cleaner.create(this, new Deallocator(base, size, cap));
        att = null;
    }
Bits工具类预分配逻辑: 先判断是否申请的内存大小超额,如未超额则正常放行返回,否则先通过tryHandlePendingReference(实际调用的Reference#tryHandlePending(false))尝试以非堵塞的方式将GC后除了Cleaner外没有其他引用的DirectByteBuffer的堆外内存释放掉。注意这里会一直尝试去释放,直到成功或者在tryHandlePending内部抛出了OOME后才被终止。然后这时会通过System.gc触发一次Full GC,通过Full GC遍历引用时来将更多的除Cleaner外没有其他引用的DirectByteBuffer通过ReferenceHandler来进行堆外内存的释放,但由于System.gc并不能够保证马上触发Full GC,因此这里会进行最多9次尝试,看是否有足够的可用堆外内存来分配堆外内存。并且每次尝试后,如果失败都指数级sleep,给JVM足够的时间去完成full gc操作。如果9次尝试后依旧没有足够的可用堆外内存来分配本次堆外内存,则抛出OutOfMemoryError(“Direct buffer memory”)异常。
static void reserveMemory(long size, int cap) {
        if (!memoryLimitSet && VM.isBooted()) {
            maxMemory = VM.maxDirectMemory();
            memoryLimitSet = true;
        }

        // optimist!
        if (tryReserveMemory(size, cap)) {
            return;
        }

        final JavaLangRefAccess jlra = SharedSecrets.getJavaLangRefAccess();

        // retry while helping enqueue pending Reference objects
        // which includes executing pending Cleaner(s) which includes
        // Cleaner(s) that free direct buffer memory
        while (jlra.tryHandlePendingReference()) {
            if (tryReserve在ory(size, cap)) {
                return;
            }
        }

        // trigger VM's Reference processing
        System.gc();

        // a retry loop with exponential back-off delays
        // (this gives VM some time to do it's job)
        boolean interrupted = false;
        try {
            long sleepTime = 1;
            int sleeps = 0;
            while (true) {
                if (tryReserveMemory(size, cap)) {
                    return;
                }
                if (sleeps >= MAX_SLEEPS) {
                    break;
                }
                if (!jlra.tryHandlePendingReference()) {
                    try {
                        Thread.sleep(sleepTime);
                        sleepTime <<= 1;
                        sleeps++;
                    } catch (InterruptedException e) {
                        interrupted = true;
                    }
                }
            }

            // no luck
            throw new OutOfMemoryError("Direct buffer memory");

        } finally {
            if (interrupted) {
                // don't swallow interrupts
                Thread.currentThread().interrupt();
            }
        }
    }
判断是否超额的相关方法实现:
    private static boolean tryReserveMemory(long size, int cap) {
        // -XX:MaxDirectMemorySize limits the total capacity rather than the
        // actual memory usage, which will differ when buffers are page
        // aligned.
        long totalCap;
        while (cap <= maxMemory - (totalCap = totalCapacity.get())) {
            if (totalCapacity.compareAndSet(totalCap, totalCap + cap)) {
                reservedMemory.addAndGet(size);
                count.incrementAndGet();
                return true;
            }
        }

        return false;
    }
Cleaner的抽象父类Reference几个重要的变量和非常核心的tryHandlePending方法:
  /* When active:   next element in a discovered reference list maintained by GC (or this if last)
     *     pending:   next element in the pending list (or null if last)
     *   otherwise:   NULL
     */
    transient private Reference<T> discovered;  /* used by VM */


    /* Object used to synchronize with the garbage collector.  The collector
     * must acquire this lock at the beginning of each collection cycle.  It is
     * therefore critical that any code holding this lock complete as quickly
     * as possible, allocate no new objects, and avoid calling user code.
     */
    static private class Lock { }
    private static Lock lock = new Lock();


    /* List of References waiting to be enqueued.  The collector adds
     * References to this list, while the Reference-handler thread removes
     * them.  This list is protected by the above lock object. The
     * list uses the discovered field to link its elements.
     */
    private static Reference<Object> pending = null;

    /**
     * Try handle pending {@link Reference} if there is one.<p>
     * Return {@code true} as a hint that there might be another
     * {@link Reference} pending or {@code false} when there are no more pending
     * {@link Reference}s at the moment and the program can do some other
     * useful work instead of looping.
     *
     * @param waitForNotify if {@code true} and there was no pending
     *                      {@link Reference}, wait until notified from VM
     *                      or interrupted; if {@code false}, return immediately
     *                      when there is no pending {@link Reference}.
     * @return {@code true} if there was a {@link Reference} pending and it
     *         was processed, or we waited for notification and either got it
     *         or thread was interrupted before being notified;
     *         {@code false} otherwise.
     */
    static boolean tryHandlePending(boolean waitForNotify) {
        Reference<Object> r;
        Cleaner c;
        try {
            synchronized (lock) {
                if (pending != null) {
                    r = pending;
                    // 'instanceof' might throw OutOfMemoryError sometimes
                    // so do this before un-linking 'r' from the 'pending' chain...
                    c = r instanceof Cleaner ? (Cleaner) r : null;
                    // unlink 'r' from 'pending' chain
                    pending = r.discovered;
                    r.discovered = null;
                } else {
                    // The waiting on the lock may cause an OutOfMemoryError
                    // because it may try to allocate exception objects.
                    if (waitForNotify) {
                        lock.wait();
                    }
                    // retry if waited
                    return waitForNotify;
                }
            }
        } catch (OutOfMemoryError x) {
            // Give other threads CPU time so they hopefully drop some live references
            // and GC reclaims some space.
            // Also prevent CPU intensive spinning in case 'r instanceof Cleaner' above
            // persistently throws OOME for some time...
            Thread.yield();
            // retry
            return true;
        } catch (InterruptedException x) {
            // retry
            return true;
        }
        // Fast path for cleaners
        if (c != null) {
            c.clean();
            return true;
        }
        ReferenceQueue<? super Object> q = r.queue;
        if (q != ReferenceQueue.NULL) q.enqueue(r);
        return true;
    }
Reference类静态代码块中启动的高优先级的ReferenceHandler线程,主要靠它来轮询pending链表进行堆外内存的回收。
static {
        ThreadGroup tg = Thread.currentThread().getThreadGroup();
        for (ThreadGroup tgn = tg;
             tgn != null;
             tg = tgn, tgn = tg.getParent());
        Thread handler = new ReferenceHandler(tg, "Reference Handler");
       /* If there were a special system-only priority greater than
         * MAX_PRIORITY, it would be used here
         */
        handler.setPriority(Thread.MAX_PRIORITY);
        handler.setDaemon(true);
        handler.start();
        // provide access in SharedSecrets
        SharedSecrets.setJavaLangRefAccess(new JavaLangRefAccess() {
            @Override
            public boolean tryHandlePendingReference() {
                return tryHandlePending(false);
            }
        });
    }
Cleaner类几个核心变量:静态的first,私有的next,prev,一个没啥用的dummyQueue。first、next、prev主要用来维护一个双向链表,用来保证他们引用的referent被回收前自身不会被GC掉,这也是为啥first需要是static的原因。在Cleaner create的时候会把自己通过add加入到双向链表中,另外在tryHandlePending调用clean进行堆外内存清理时,通过remove方法将自身从双向链表中移除,这样这个没用的Cleaner本身也能被GC掉了。另外ReferenceQueue是作为 JVM GC与上层Reference对象管理之间的一个消息传递方式,它使得我们可以对所监听的对象引用可达发生变化时做一些处理,但在Cleaner里这个dummyQueue没有用,因为在tryHandlePending里如果是Cleaner就调用完它的clean方法后直接返回,不会和这个queue做啥交互,这也是为啥这个queue在Cleaner里叫dummyQueue的原因。
// Dummy reference queue, needed because the PhantomReference constructor
    // insists that we pass a queue.  Nothing will ever be placed on this queue
    // since the reference handler invokes cleaners explicitly.
    private static final ReferenceQueue<Object> dummyQueue = new ReferenceQueue<>();

    // Doubly-linked list of live cleaners, which prevents the cleaners
    // themselves from being GC'd before their referents
    static private Cleaner first = null;

    private Cleaner
        next = null,
        prev = null;
Cleaner类创建时传入的Runnable是一个Deallocator对象,该对象底层通unsafe的freeMemory来完成真正的堆外内存清理。
 public static Cleaner create(Object var0, Runnable var1) {
        return var1 == null ? null : add(new Cleaner(var0, var1));
    }
    public void clean() {
        if (remove(this)) {
            try {
                this.thunk.run();
            } catch (final Throwable var2) {
                AccessController.doPrivileged(new PrivilegedAction<Void>() {
                    public Void run() {
                        if (System.err != null) {
                            (new Error("Cleaner terminated abnormally", var2)).printStackTrace();
                        }

                        System.exit(1);
                        return null;
                    }
                });
            }

        }
    }

    private static class Deallocator
        implements Runnable
    {
        private static Unsafe unsafe = Unsafe.getUnsafe();

        private long address;
        private long size;
        private int capacity;

        private Deallocator(long address, long size, int capacity) {
            assert (address != 0);
            this.address = address;
            this.size = size;
            this.capacity = capacity;
        }

        public void run() {
            if (address == 0) {
                // Paranoia
                return;
            }
            unsafe.freeMemory(address);
            address = 0;
            Bits.unreserveMemory(size, capacity);
        }

    }
Unsafe.allocateMemory的C++的Native实现,底层使用的C库的malloc来进行分配。
    UNSAFE_ENTRY(jlong, Unsafe_AllocateMemory(JNIEnv *env, jobject unsafe, jlong size))
      UnsafeWrapper("Unsafe_AllocateMemory");
      size_t sz = (size_t)size;
      if (sz != (julong)size || size < 0) {
        THROW_0(vmSymbols::java_lang_IllegalArgumentException());
      }
      if (sz == 0) {
        return 0;
      }
      sz = round_to(sz, HeapWordSize);
      void* x = os::malloc(sz, mtInternal);
      if (x == NULL) {
        THROW_0(vmSymbols::java_lang_OutOfMemoryError());
      }
      //Copy::fill_to_words((HeapWord*)x, sz / HeapWordSize);
      return addr_to_java(x);
    UNSAFE_END
6. 确认堆外内存的回收情况
了解到DirectByteBuffer的分配和回收机制,正常情况下,一个DirectByteBuffer在使用完并不需要主动释放堆外内存,分配时如果由于超额导致堆外内存不够分配会尝试回收已经空闲的DirectByteBuffer底层的堆外内存,另外那条高优先级的ReferenceHandler线程也会不停将GC识别出来没引用的DirectByteBuffer的堆外内存进行回收。 由于线上并没有MaxDirectMemorySize的设置(默认和Xmx大小一样),因此基本不会触发超额的问题。这里尝试进行一次手动Full GC,看下ReferenceHandler线程能回收多少堆外内存。
jmap -histo:live pid
将线上服务暂停处理,然后手动强制进行Full GC,一段时间后通过JMC发现占用的堆外内存数量和大小居然都没有减少,这个有点意外,因为ReferenceHandler线程是最高优先级的,一般不会出啥问题,只能说明DirectByteBuffer的堆外内存不能被回收是因为除了Cleaner这个幻象引用还有其他引用。
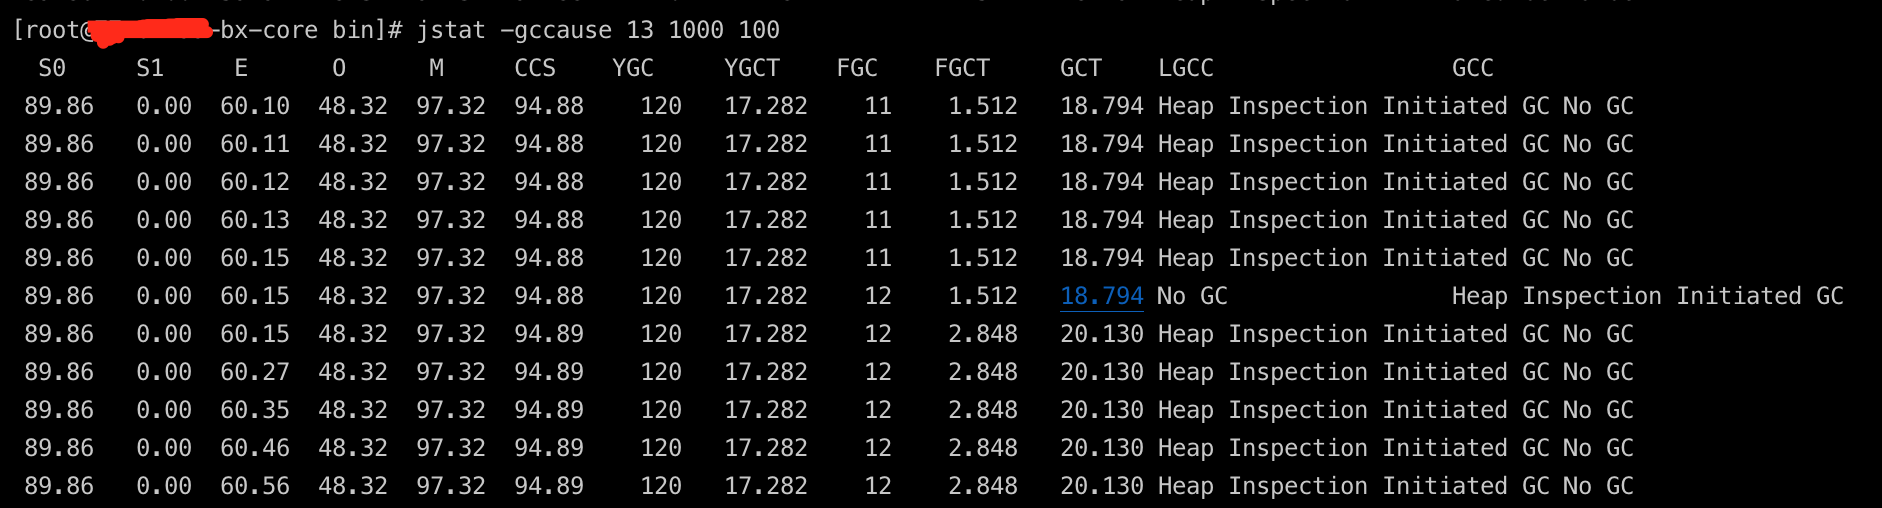
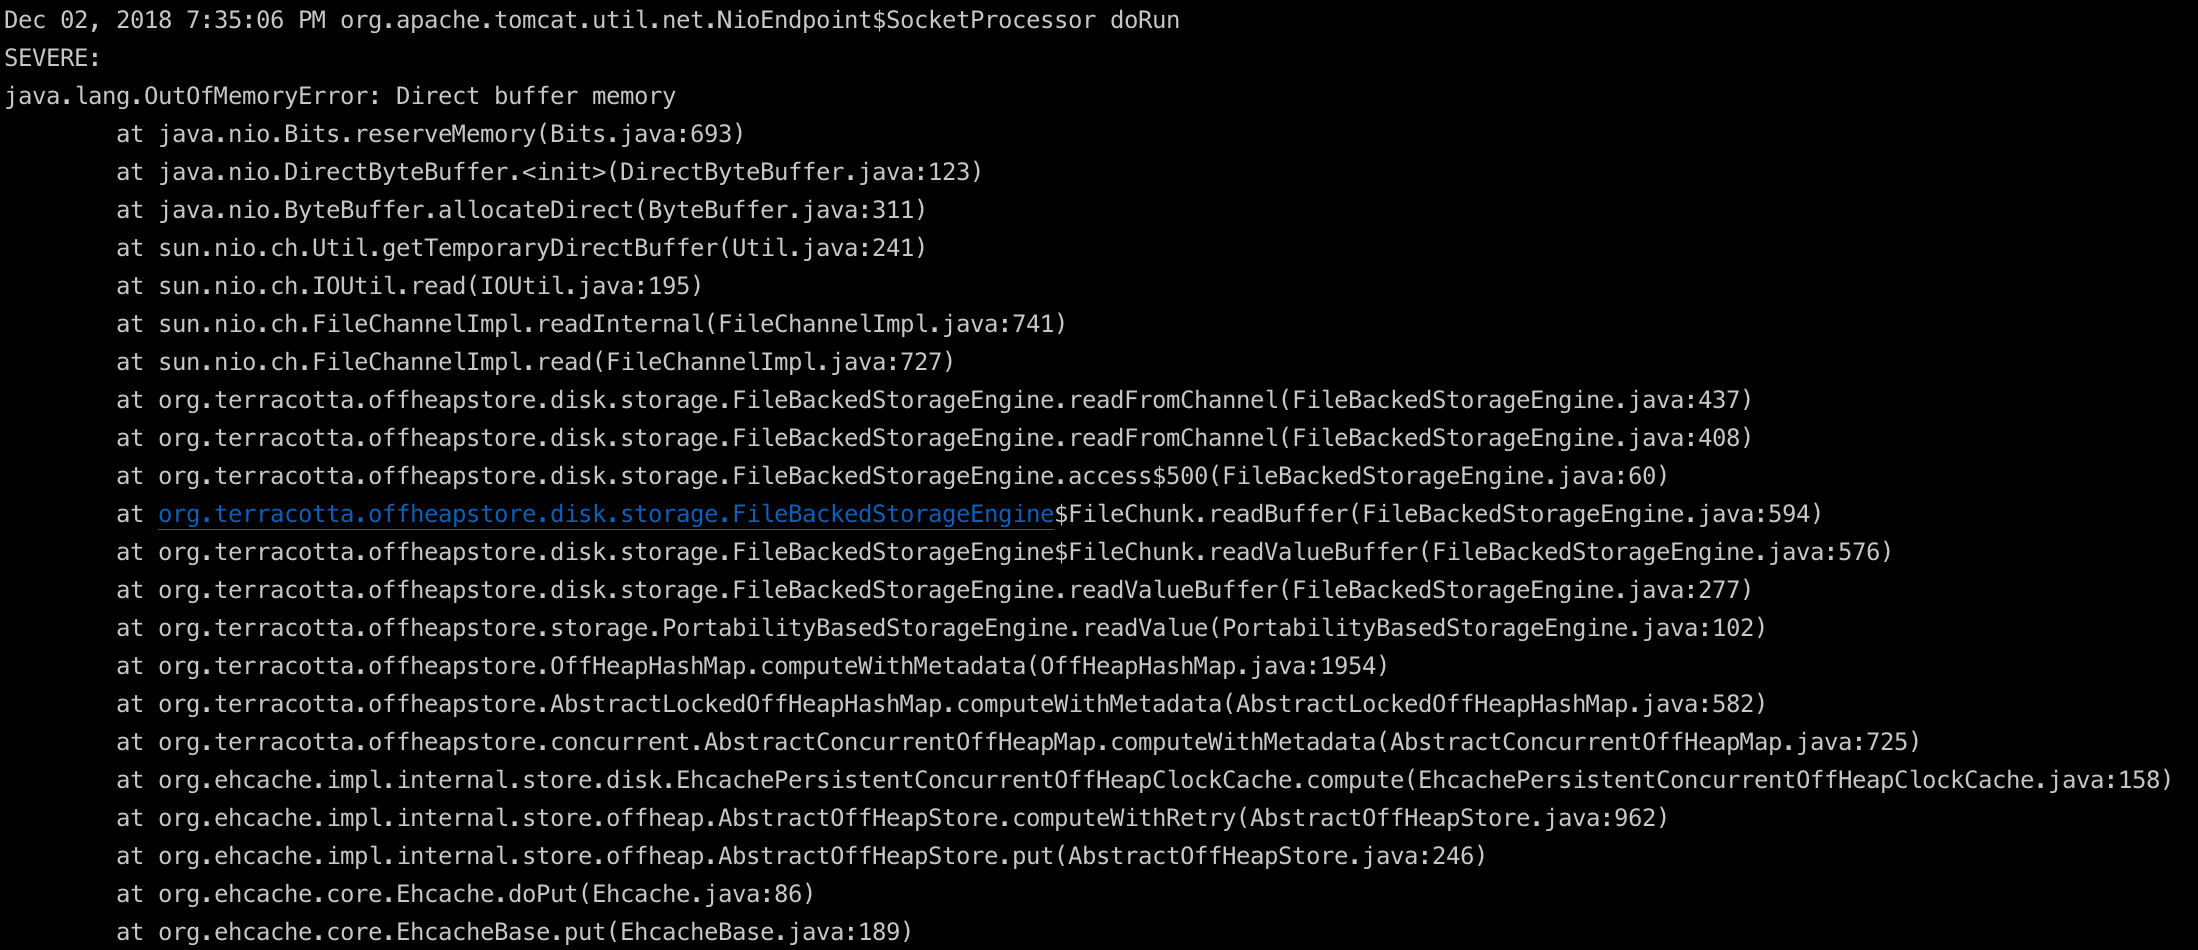
进一步确认,接着尝试JVM进程启动时设置-XX:MaxDirectMemorySize=800m,查看gc log,发现堆外内存到达800M时,确实抛出了OOME也触发了System GC,但却没有能回收到堆外内存。
7. 分析不能被回收的DirectByteBuffer的引用
jmap -dump:live,file=199.bin 12
这里堆dump的时候通过live在dump前进行一次Full GC,这样只会保留不能被GC的对象,降低干扰,方便问题排查。然后使用MAT对堆dump进行分析。
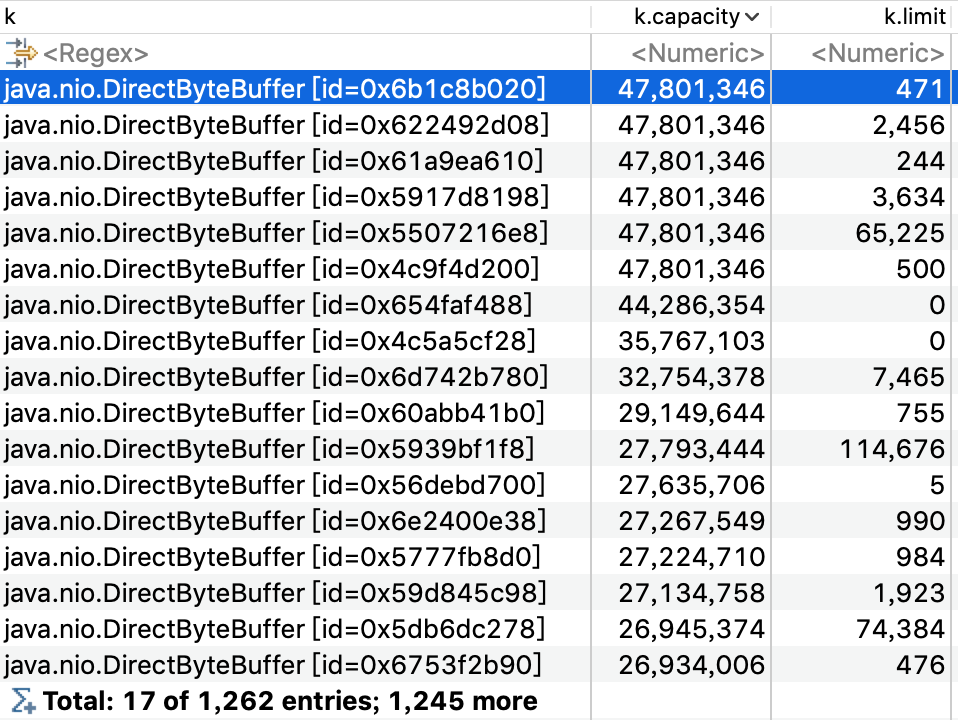
- OQL过滤出被引用对象大于1个的DirectByteBuffer,并且把持有的堆外内存的实际大小capacity列出来。之所以过滤出被引用对象大于1个是找到除了Cleaner外还有其他引用的DirectByteBuffer。
SELECT k, k.capacity, k.limit FROM java.nio.DirectByteBuffer k WHERE (inbounds(k).size() > 1)
将DirectByteBuffer按capacity进行排序,发现最大的DirectByteBuffer占用内存达到了40多M,粗略把这些DirectByteBuffer的capacity累加,基本和增长的堆外内存大小差不多。
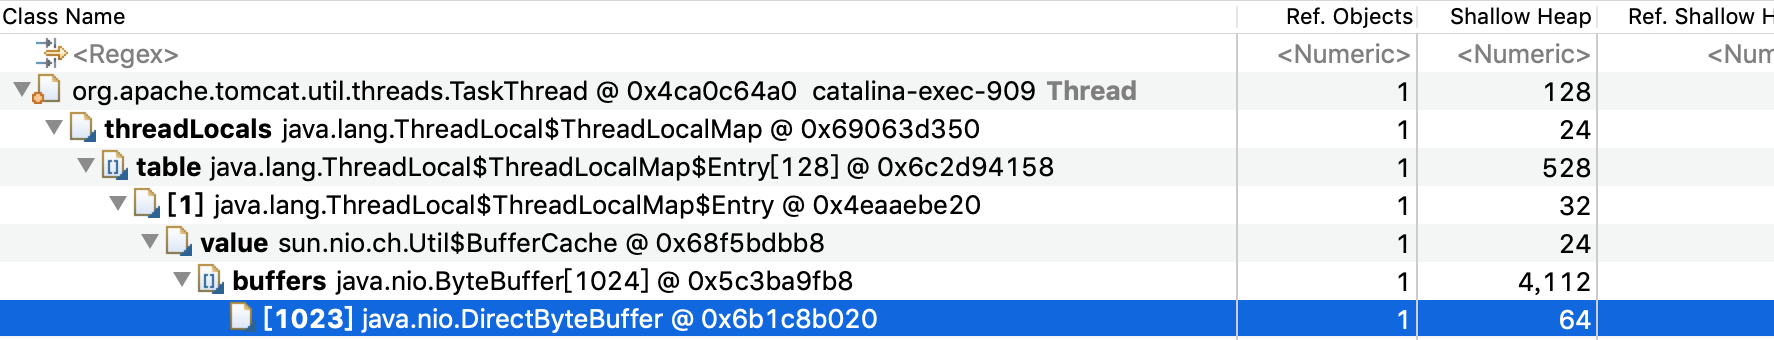
通过Merge Shortest Paths to GC ROOTs或者List Objects->with incoming references看一下这些DirectByteBuffer不能被回收的引用路径,并排除掉幻象引用、弱引用、软引用这些实际可以回收的对象。
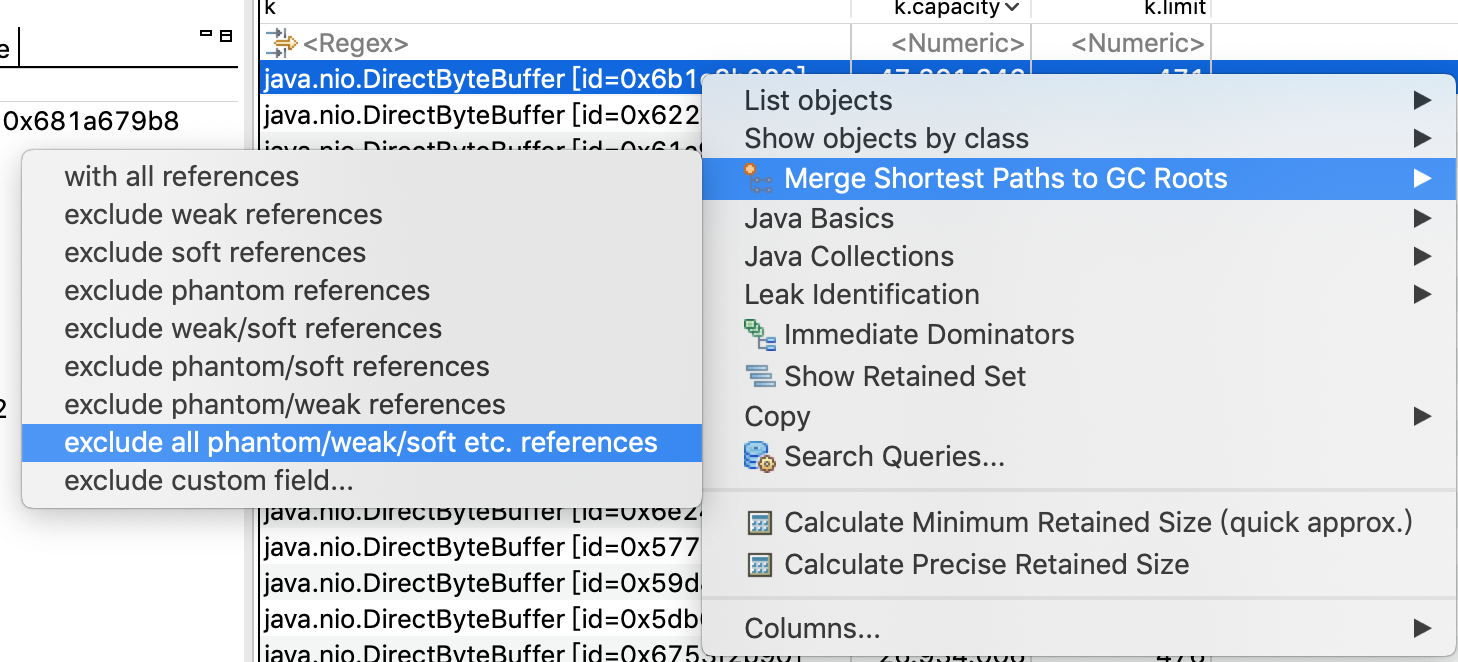
确认这些不能被回收的DirectByteBuffer是被Tomcat的worker线程的ThreadLocal引用。但没有具体调用栈,看不出什么场景被引用上的,接下来用BTrace来跟踪一下具体DirectByteBuffer申请的调用链路。
8. Btrace跟踪DirectByteBuffer的堆外内存申请路径
当有申请请求时,通过btrace把线程栈打出来,定位调用源头。btrace的使用方法在这里不细说,可以参考之前写的关于btrace的文章问题排查利器之-JVM动态追踪工具BTrace。
import com.sun.btrace.annotations.*;
import static com.sun.btrace.BTraceUtils.*;

@BTrace
public class TraceDirectAlloc {
    @OnMethod(clazz="java.nio.Bits", method="reserveMemory")
    public static void printThreadStack() {
        println("==============thread dump where reserveMemory invoked!");
        jstack();
    }
}
sh bin/btrace 12 TraceDirectAlloc.java > alloc.log
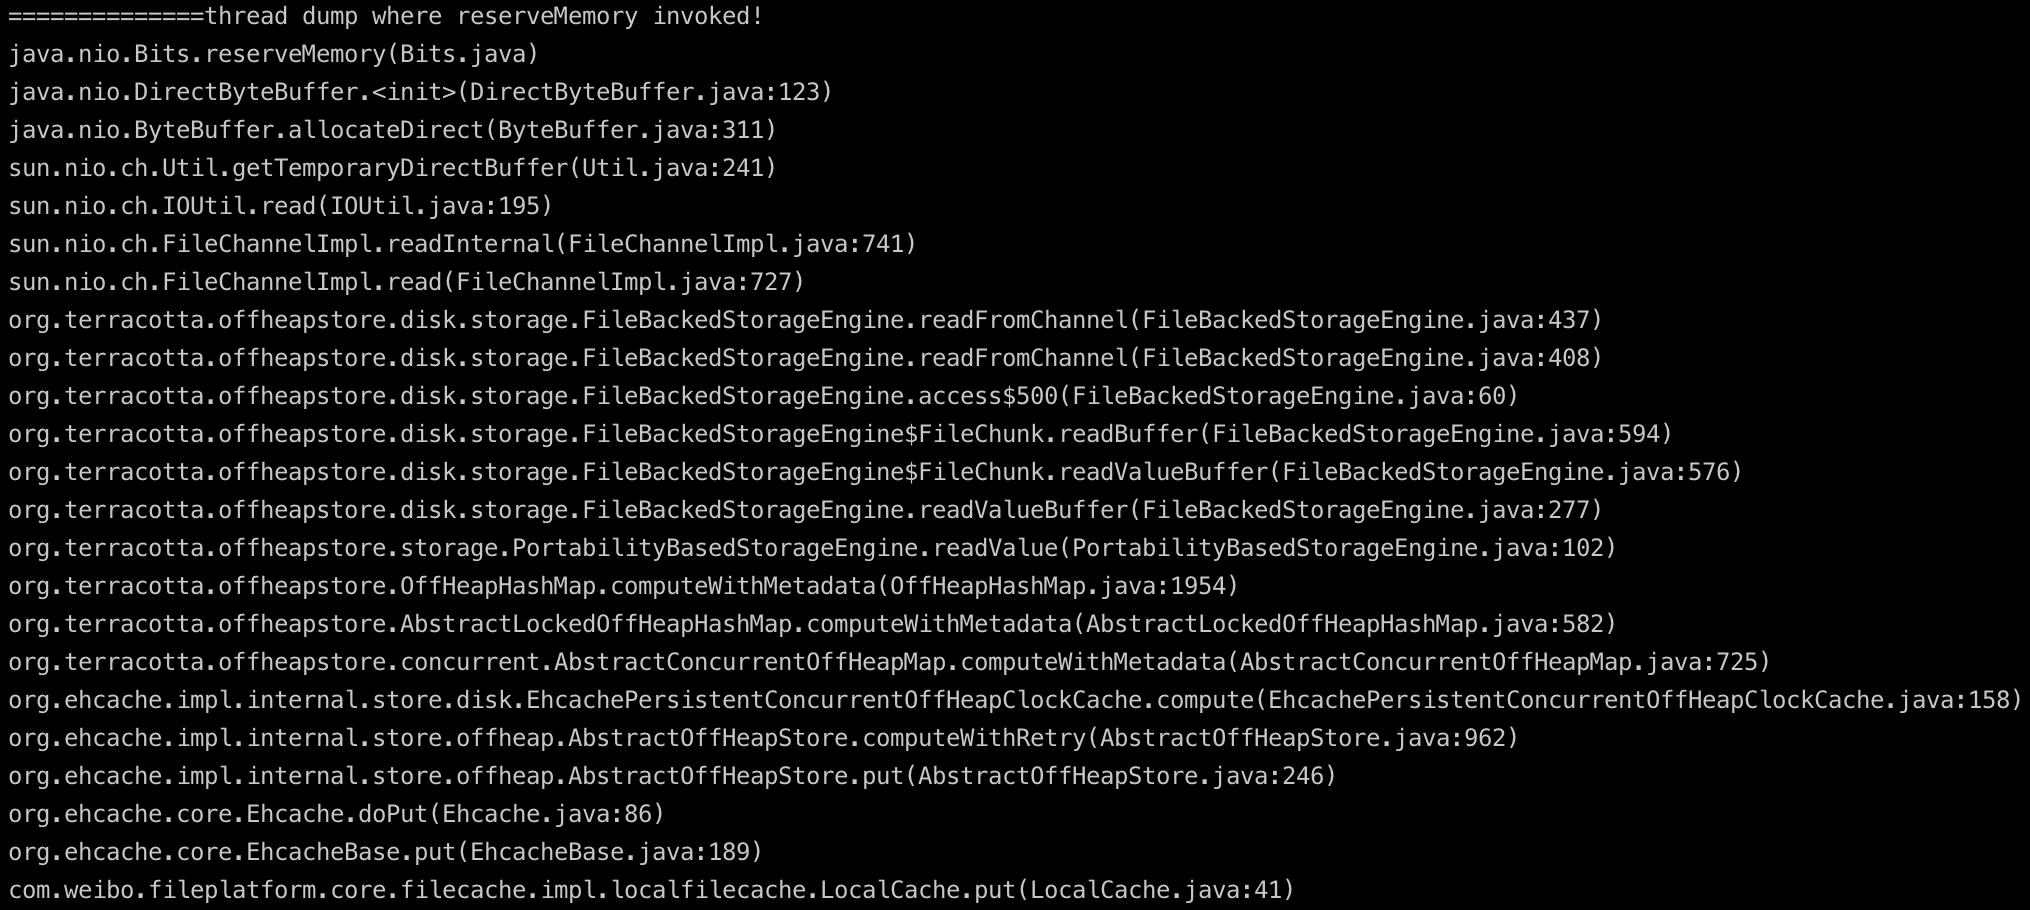
和没有问题的服务的btrace比较,发现较多这种线程栈,看方法名应该是往ehcache磁盘缓存写数据时会用到DirectByteBuffer,进一步分析。
9. Ehcache的磁盘缓存写文件分析
当有文件需要暂存到ehcache的磁盘缓存时,使用到了NIO中的FileChannel来读取文件,默认ehcache使用了堆内的HeapByteBuffer来给FileChannel作为读取文件的缓冲,FileChannel读取文件使用的IOUtil的read方法,针对HeapByteBuffer底层还用到一个临时的DirectByteBuffer来和操作系统进行直接的交互。
ehcache使用HeapByteBuffer作为读文件缓冲:
ByteBuffer readBuffer(long position, int length) {
            try {
                ByteBuffer data = ByteBuffer.allocate(length);

                int read;
                for(int i = 0; data.hasRemaining(); i += read) {
                    read = FileBackedStorageEngine.this.readFromChannel(data, position + (long)i);
                    if (read < 0) {
                        throw new EOFException();
                    }
                }

                return (ByteBuffer)data.rewind();
            } catch (IOException var7) {
                throw new RuntimeException(var7);
            } catch (OutOfMemoryError var8) {
                FileBackedStorageEngine.LOGGER.error("Failed to allocate direct buffer for FileChannel read.  Consider increasing the -XX:MaxDirectMemorySize property to allow enough space for the FileChannel transfer buffers");
                throw var8;
            }
        }
IOUtil对于HeapByteBuffer实际会用到一个临时的DirectByteBuffer来和操作系统进行交互。
static int read(FileDescriptor fd, ByteBuffer dst, long position,
                    NativeDispatcher nd)
        throws IOException
    {
        if (dst.isReadOnly())
            throw new IllegalArgumentException("Read-only buffer");
        if (dst instanceof DirectBuffer)
            return readIntoNativeBuffer(fd, dst, position, nd);

        // Substitute a native buffer
        ByteBuffer bb = Util.getTemporaryDirectBuffer(dst.remaining());
        try {
            int n = readIntoNativeBuffer(fd, bb, position, nd);
            bb.flip();
            if (n > 0)
                dst.put(bb);
            return n;
        } finally {
            Util.offerFirstTemporaryDirectBuffer(bb);
        }
    }
10. DirectByteBuffer泄露根因分析
重点来了: 默认情况下这个临时的DirectByteBuffer会被缓存在一个ThreadLocal的bufferCache里不会释放,每一个bufferCache有一个DirectByteBuffer的数组,每次当前线程需要使用到临时DirectByteBuffer时会取出自己bufferCache里的DirectByteBufferS,选取一个不小于所需size的,如果bufferCache为空或者没有符合的,就会调用Bits重新创建一个,使用完之后再缓存到bufferCache里。这里的问题在于 :这个bufferCache是ThreadLocal的,意味着极端情况下有N个调用线程就会有N组 bufferCache,就会有N组DirectByteBuffer被缓存起来不被释放,而且不同于在IO时直接使用DirectByteBuffer,这N组DirectByteBuffer连GC时都不会回收。我们的文件服务在读写ehcache的磁盘缓存时直接使用的tomcat的worker线程池,这个worker线程池的上限是3000,SO。。。这种隐藏的问题影响所有使用到HeapByteBuffer的地方而且很隐秘,在类似我们这种文件服务的大sizeIO且调用线程比较多的场景下容易暴露出来。
获取临时DirectByteBuffer的逻辑:
/**
     * Returns a temporary buffer of at least the given size
     */
    public static ByteBuffer getTemporaryDirectBuffer(int size) {
        BufferCache cache = bufferCache.get();
        ByteBuffer buf = cache.get(size);
        if (buf != null) {
            return buf;
        } else {
            // No suitable buffer in the cache so we need to allocate a new
            // one. To avoid the cache growing then we remove the first
            // buffer from the cache and free it.
            if (!cache.isEmpty()) {
                buf = cache.removeFirst();
                free(buf);
            }
            return ByteBuffer.allocateDirect(size);
        }
    }
bufferCache从ByteBuffer数组里选取合适的ByteBuffer:
 /**
         * Removes and returns a buffer from the cache of at least the given
         * size (or null if no suitable buffer is found).
         */
        ByteBuffer get(int size) {
            if (count == 0)
                return null;  // cache is empty

            ByteBuffer[] buffers = this.buffers;

            // search for suitable buffer (often the first buffer will do)
            ByteBuffer buf = buffers[start];
            if (buf.capacity() < size) {
                buf = null;
                int i = start;
                while ((i = next(i)) != start) {
                    ByteBuffer bb = buffers[i];
                    if (bb == null)
                        break;
                    if (bb.capacity() >= size) {
                        buf = bb;
                        break;
                    }
                }
                if (buf == null)
                    return null;
                // move first element to here to avoid re-packing
                buffers[i] = buffers[start];
            }

            // remove first element
            buffers[start] = null;
            start = next(start);
            count--;

            // prepare the buffer and return it
            buf.rewind();
            buf.limit(size);
            return buf;
        }
将ByteBuffer回种到bufferCache:
/**
     * Releases a temporary buffer by returning to the cache or freeing it. If
     * returning to the cache then insert it at the start so that it is
     * likely to be returned by a subsequent call to getTemporaryDirectBuffer.
     */
    static void offerFirstTemporaryDirectBuffer(ByteBuffer buf) {
        assert buf != null;
        BufferCache cache = bufferCache.get();
        if (!cache.offerFirst(buf)) {
            // cache is full
            free(buf);
        }
    }
分析结论
NIO中的FileChannel、SocketChannel等Channel默认在通过IOUtil进行IO读写操作时,除了会使用HeapByteBuffer作为和应用程序的对接缓冲,但在底层还会使用一个临时的DirectByteBuffer来和系统进行真正的IO交互,为提高性能,当使用完后这个临时的DirectByteBuffer会被存放到ThreadLocal的缓存中不会释放,当直接使用HeapByteBuffer的线程数较多或者IO操作的size较大时,会导致这些临时的DirectByteBuffer占用大量堆外内存造成泄露。
那么除了减少直接调用ehcache读写的线程数有没有其他办法能解决这个问题?并发比较高的场景下一味减少业务线程数不是一个好办法。答案是有的!
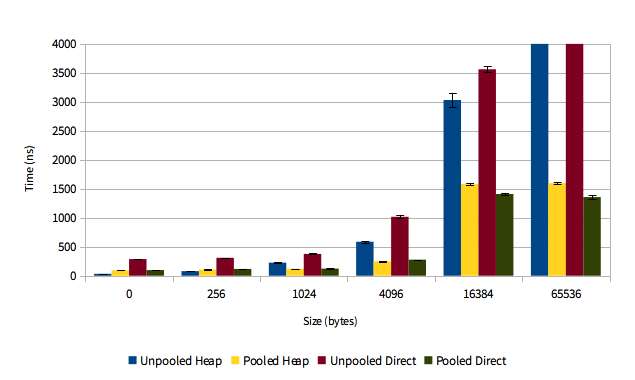
在Java1.8_102版本开始,官方提供一个参数jdk.nio.maxCachedBufferSize,这个参数用于限制可以被缓存的DirectByteBuffer的大小,对于超过这个限制的DirectByteBuffer不会被缓存到ThreadLocal的bufferCache中,这样就能被GC正常回收掉。唯一的tradeoff是读写的性能会稍差一些,毕竟创建一个新的DirectByteBuffer的代价也不小,当然如上面列出的,性能也没有数量级的差别。我们业务就是调整了-Djdk.nio.maxCachedBufferSize=500000(注意这里是字节数,不能用m、k、g)之后,运行几天整体DirectByteBuffer稳定控制在300m左右,性能也几乎没有衰减。
搞定收工 !
参考: NMT使用介绍 open jdk 话说ReferenceQueue 池化、非池化、堆内、堆外四种ByteBuffer性能比对 java8u102 release note Fixing Java’s ByteBuffer native memory “leak”